6주차 수업에서 설명한 BABIP의 개념을 직접 확인하고 해석할 수 있는 예제입니다.
2026년 정규시즌 아메리칸리그(AL) 다승 1~20위 투수들의 BABIP을 직접 계산하고 시각화합니다.
1. 데이터 개요
2026년 아메리칸리그(AL) 다승 1~20위 투수들의 기록
다승 동점자가 있는 경우 모두 포함
2. 데이터 가져오기
2.1. 라이브러리 호출
library(baseballr)
library(dplyr)
library(ggplot2)
2.2. 전체 투수 원데이터 가져오기
mlb_stats()함수 이용인자값은 다음과 같이 설정
league_id = 103: 아메리칸리그game_type = "R": 정규시즌player_pool = "All": 규정 이닝을 채우지 못한 투수도 순위 후보에 포함BABIP 계산에 필요한 여섯 개 지표도 함께 가져옴
pitching_raw <- baseballr::mlb_stats(
  stat_type = "season",
  stat_group = "pitching",
  season = 2026L,
  league_id = 103,
  sport_ids = 1,
  game_type = "R",
  player_pool = "All",
  limit = 1000
) %>%
  select(player_id, player_full_name, wins, hits, home_runs, at_bats, strike_outs, sac_flies)

pitching_raw %>%
  head()
3. 다승 20위까지 추출
top20 <- pitching_raw %>%
  mutate(rank = min_rank(desc(wins))) %>%
  filter(rank <= 20L) %>%
  arrange(rank, player_full_name) %>%
  transmute(
    rank, player_id, Name = player_full_name,
    W = wins, H = hits, HR = home_runs,
    AB = at_bats, SO = strike_outs, SF = sac_flies
  )

top20 %>% select(rank, Name, W)
4. BABIP 계산
4.1. BABIP 계산식
4.2. BABIP 계산
babip_table <- top20 %>%
  mutate(
    in_play_hits = H - HR,
    balls_in_play = AB - SO - HR + SF,
    BABIP = in_play_hits / balls_in_play
  )

babip_table %>% head()
5. 선수 간 비교
롤리팝 그래프 : 평균을 기준점으로 2가지의 지표를 한 눈에 볼 수 있도록 시각화한 그래프
점선 : 아메리칸리그 전체 투수의 BABIP (평균)
색깔 : 평균보다 낮으면 파란색, 높으면 주황색
점의 크기: 승수
league_babip <- with(
  pitching_raw,
  (sum(hits) - sum(home_runs)) /
    (sum(at_bats) - sum(strike_outs) - sum(home_runs) + sum(sac_flies))
)

plot_df <- babip_table %>%
  mutate(
    Name = reorder(Name, BABIP),
    side = ifelse(BABIP < league_babip, "Below league avg", "Above league avg")
  )

ggplot(plot_df, aes(y = Name, color = side)) +
  geom_vline(xintercept = league_babip, linetype = "dashed", color = "grey40") +
  geom_segment(aes(x = league_babip, xend = BABIP, yend = Name), linewidth = 0.8) +
  geom_point(aes(x = BABIP, size = W)) +
  geom_text(aes(x = BABIP, label = sprintf("%.3f", BABIP)),
            nudge_x = ifelse(plot_df$BABIP < league_babip, -0.004, 0.004),
            hjust = ifelse(plot_df$BABIP < league_babip, 1, 0),
            size = 3, show.legend = FALSE) +
  scale_color_manual(values = c("Below league avg" = "#155e83", "Above league avg" = "#d9822b")) +
  scale_x_continuous(expand = expansion(mult = 0.1)) +
  scale_size_continuous(range = c(2.5, 6)) +
  labs(
    title = "AL Win Top 20's BABIP vs. League Average",
    subtitle = sprintf("2026 Regular Season | dashed line = league avg %.3f", league_babip),
    x = "BABIP", y = NULL, color = NULL, size = "Wins"
  ) +
  theme_minimal(base_size = 12) +
  theme(panel.grid.major.y = element_blank(), legend.position = "bottom")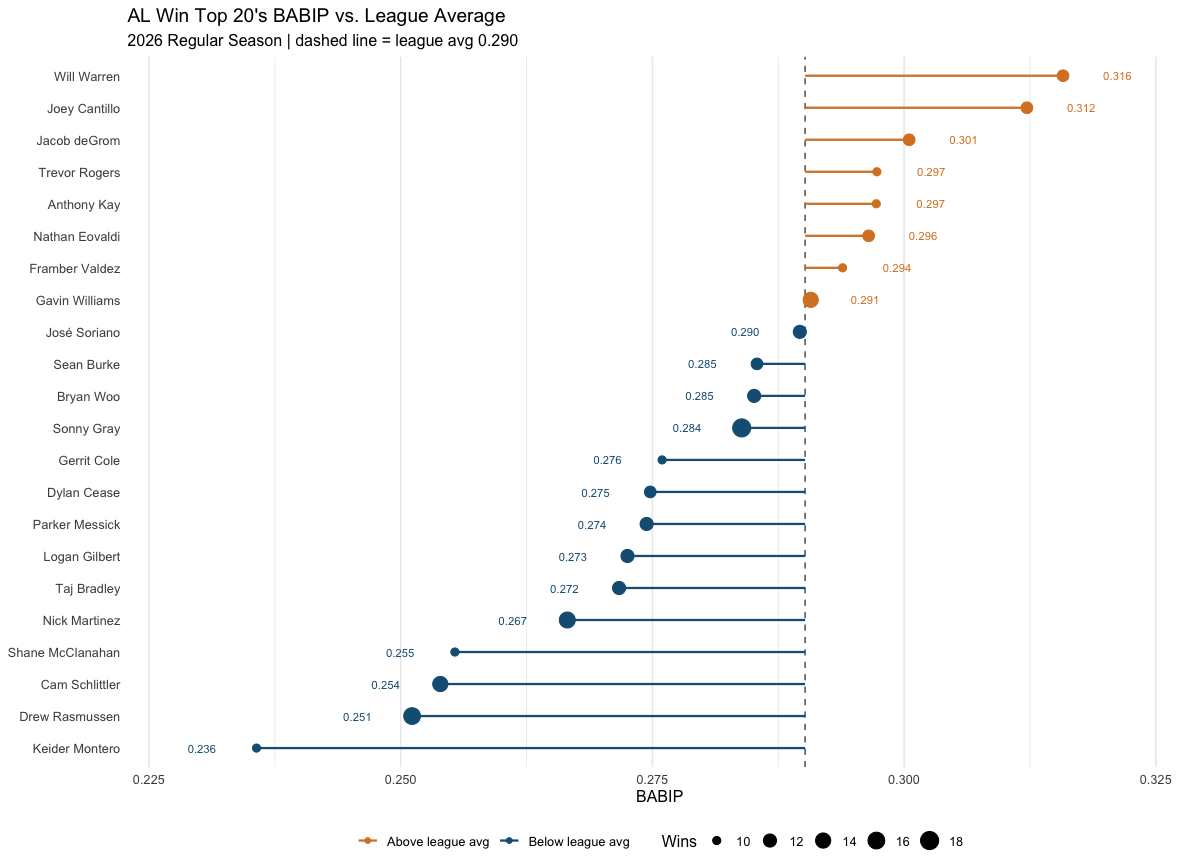
Figure 1:2026 AL 다승 상위 20명의 BABIP